There are a few noticeable takeaways from this map that we’ll get into below. For instance, why do some states show such strong progress? Why are others lagging behind? Why aren’t the sunniest states benefiting the most from accessible solar? Answers to these and more below.
This is the most comprehensive source yet created to track community solar across America, but NREL notes that, while its data has been reviewed, it may still contain errors, may not be fully comprehensive, may include duplicates, and is missing information in some places (shown through blank spaces in project details).
The data also tracks projects through June 2019, meaning it lacks newly built solar farms in the last year. If you have additional data to provide, updated info can be submitted to Jenny Heeter at jenny.heeter@nrel.gov.
Why Community Solar Clusters In Certain States
It’s hard not to notice in the map above that some parts of the country have a good deal more red and orange than others. This might come as a surprise to some readers. If community solar is truly free to join, it’s good for customers, it stimulates the local economy, and it’s good for the planet…why isn’t it everywhere?
We’ve written about the top states in community solar, such as New York, Massachusetts, Minnesota, and Colorado. The quality that has set these successful states apart isn’t their extra sunshiney climate–in fact, none of these states even rank in the top five when it comes to annual sunshine. Instead, it is government legislation enacted to support community solar development.
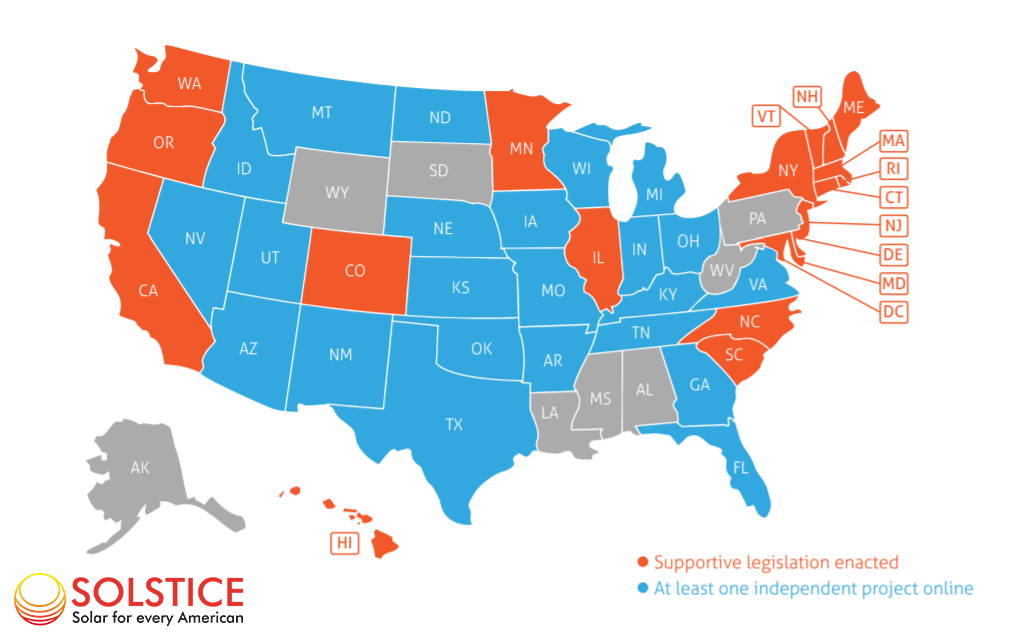
Over the last decade, solar has become one of the cheapest forms of energy to produce. However, it still requires legislative support to get built. State laws around how customers earn credits for solar power, how developers earn revenue, how solar sites can be selected, how utilities integrate distributed energy into their grids and more all affect whether a state is ready for community solar.
Looking at the map, the states that are lagging behind on community solar are often the states with some sort of interest or investment in other energy sources. Pennsylvania has fracking, West Virginia has coal, the gulf coast and states out west have oil, and so forth.
Yet wherever your state is on community solar today, the trend is clear: a host of new states are hopping aboard right now.
Maine and Illinois are just beginning to ramp up community solar projects in 2020, so expect those states to look very different on this map a year from now. Pennsylvania, New Mexico, Maryland, and New Jersey have all pushed forward crucial legislation that will grow their community solar programs as well. Most of these states are sparse according to NREL’s current data, but that will change very quickly.
U.S. Community Solar In 2019 vs. 2018
If you’ve enjoyed the maps so far, we’ve got one more for you: NREL’s index of U.S. community solar projects in 2018. Here’s what the country looked like one year prior: